Debugging Python scripts
Since version 1.4, Siril embarks a Python machine to write advanced scripts
.
This tutorial shows how to debug Python scripts you may write using an IDE.
This is in no way a tutorial to learn how to write in Python. We also assume you
have a good working knowledge of Siril.
This tutorial is written using VSCode
.
You can of course replicate this using another IDE.
Prerequisites #
Before jumping in this tutorial, you will of course need to have:
- installed Siril 1.4.0 or higher
- started it at least once to have the Python machine up and running.
You can test that everything is fine using the Hello Siril script from the documentation.
We will start with writing a small script to further use in the demo.
import sirilpy as s
siril = s.SirilInterface()
if siril.connect():
    print("Connected successfully!")
else:
    print("Connection failed")

def siril_module_example():
    try:
        filename = siril.get_image_filename()
        siril.log(f"Opened file: {filename}")

    except AttributeError as e:
        siril.log(f"Error: {e}")

# Run the function
if __name__ == "__main__":
    siril_module_example()
Setting up #
In case it is not already done, install VSCode and add the following extensions:
- Python
- Python Debugger
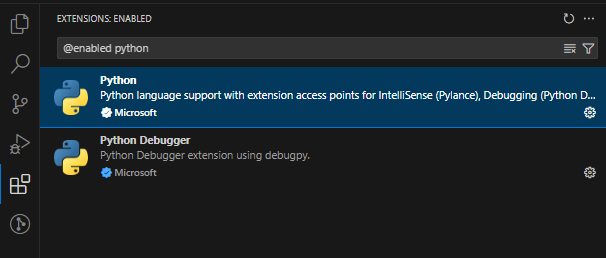
Python extensions for VSCode
Copy the script shown above and save it to, say, C:\sirilscripts\IDEdemo.py.
Now, start Siril and add C:\sirilscripts to the Scripts paths (in the Preferences).
Once you click Apply, IDEdemo.py should be present in the Scripts Menu.
Now start VSCode and open the folder C:\sirilscripts from the Welcome page.
We will now set-up a few things for this folder:
- Ctrl+Shift+P to open the command palette
- Type
Python, choosePython:Select InterpreterthenEnter interpreter pathand clickFind... - Paste this
%LOCALAPPDATA%\siril\venv\Scripts\python.exein the file name box and press Enter.
You should now see at the bottom right that the Python interpreter is set to the venv used by Siril:
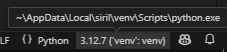
Python venv setup
We will then add a debug configuration:
- From the top menu, select
RunthenAdd configuration - In the list, choose
Python DebuggerthenAttach using Process Id
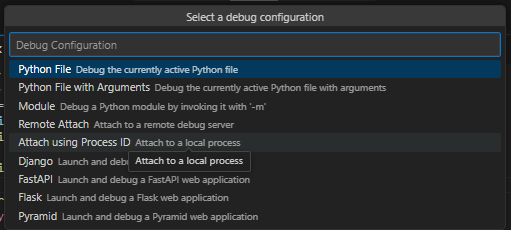
Python debug configuration
This should open a launch.json file in the editor which contains some instructions as shown below.
{
    "version": "0.2.0",
    "configurations": [
        {
            "name": "Python Debugger: Attach using Process Id",
            "type": "debugpy",
            "request": "attach",
            "processId": "${command:pickProcess}"
        }
    ]
}
This configuration will enable to attach our code to the Python process launched by Siril. Note that if you need to break into sirilpy module as well, you can add an extra line:
"justMyCode": false
Debugging #
We are now ready to debug:
- Set
Enable Python debug modeby ticking the box inScriptsmenu. - In Siril, open a image (the script is written to fetch its filename…)
- Then launch
IDEdemo.pythrough the Scripts menu. - Once the script has started, a small dialog will popup showing a ProcessID number
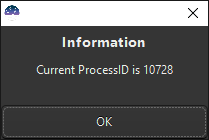
Siril debugging dialog
Now go to VSCode:
- If a terminal is not already open, open one with the
TerminalMenu - Open
IDEdemo.pyby clicking on it in the file browser to the left and add a breakpoint at line 11 (click in the margin on the left).
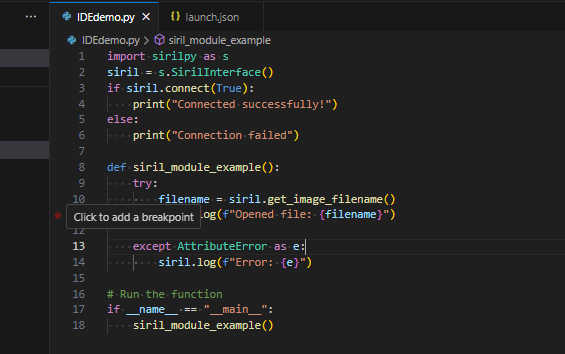
Set up a breakpoint
- With the toolbar to the the left, select Debugging (1) and launch the process (2).
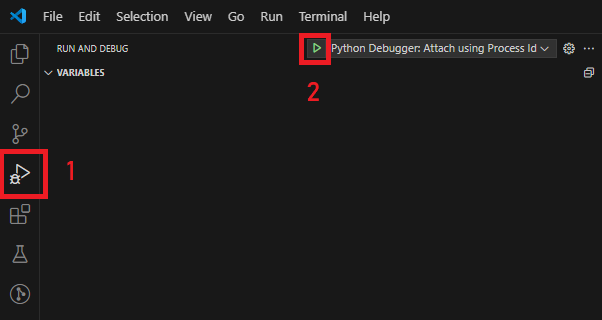
VSCode debug launch
- In the dropdown, select the process ID with the same number as shown in Siril dialog (#10728 in the present example)
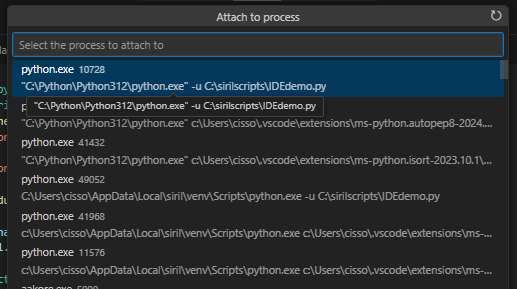
VSCode ProcessID selection
- Wait a few seconds, usually 5-6s, until the connection toolbar appears.

VSCode ProcessID connection
Congrats, you are now attached to the running Python process!
Go back to Siril and click OK in the dialog box to let the script execution continue (Use Alt+Tab
if the dialog is not visible anymore).
The code will stop at the breakpoint we’ve set, letting you access the local variables at runtime. You can also do anything an IDE allows, like evaluating new expressions etc.
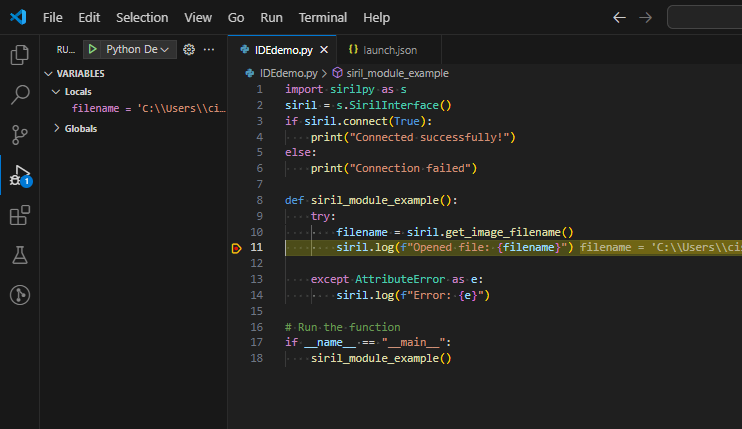
VSCode breakpoint hit
Note:
You may see in Siril console a warning like the one below:
log: 0.00s - Debugger warning: It seems that frozen modules are being used, which may
log: 0.00s - make the debugger miss breakpoints. Please pass -Xfrozen_modules=off
log: 0.00s - to python to disable frozen modules.
log: 0.00s - Note: Debugging will proceed. Set PYDEVD_DISABLE_FILE_VALIDATION=1 to disable this validation.
This should not affect the behavior. However if you want to remove it, go to Windows
Environment variables, add a new variable PYDEVD_DISABLE_FILE_VALIDATION and set its value to 1.
If you are running Siril development version and launch with msys2/mingw64, you will
need to modify C:\msys64\mingw64.ini and add PYDEVD_DISABLE_FILE_VALIDATION=1.