This is the first release candidate of the 1.0.0 version. It comes with some new features and many bug fixes compared to the previous beta version (0.99.10.1), and contain all features that will be present in the final version. From now, we will focus on bug fixes in order to release as soon as possible the 1.0.0 version.
This version also marks the arrival in the development team of Cécile (alias Cissou8) who is the author of a large number of improvements and who works on Windows! Thanks also to Florian Bénédetti for his enormous work on continuous integration.
Finally, we would like to acknowledge the excellent work carried out by the beta testers. This allowed us to make this superb version with so many bug fixes: Thierry Legault, Colmic, Batbihirulau and Stéphiou. Thank you!
Downloads #
Siril 1.0.0-rc1 is distributed for the 3 most common platforms (Windows, MacOS, GNU / Linux). See download .
But of course, since Siril is free software, it can be built on any OS from source, see the installation page .
What is new in this release? #
Astrometry: keypoint of this version #
Astrometry is the measurement of the position of stellar objects. In astrophotography, this feature is mainly used to know the position of the image with regards to the sky. Thanks to this, Siril is able to recover the colorimetry of an image by performing photometry on each star whose astrometry has associated it with a catalog. However, one of Siril’s weaknesses was with wide-field images, some of which contained a level of distortion that prevented simple astrometric resolution (also called plate-solving).
Wide field astrometry #
This new version makes it possible to attempt an astrometric resolution on only part of the image. To do this, simply draw a selection around a known object in the image, place it in the center and start astrometry. The resolution is generally very fast.

It is now possible to perform astrometry on part of the image by making a selection around a known object, here M8, the Lagoon Nebula.
Still for wide field images (FOV > 5°), the astrometric resolution is now done by default on the central part of the image only. This improves the speed and avoids resolving on a part of the image where the distortion is too great and would cause the process to fail.
Keeping WCS information in geometric operations #
When an astrometric resolution is performed on an image, the data is stored in the header of the FITS file in a format that respects the World Coordinates System (WCS) standard. This standard is very useful and allows all the software using it to get the astrometric solution of the image. However, when doing a rotation, mirror transformation or crop, this data must be updated accordingly. Previous versions of Siril only warned the user that they would be irretrievably lost. From now on, they are updated, and the user can crop an image without fear of losing any astrometric information that might prove useful later.
Keeping WCS information in Undo/Redo #
Likewise, during Undo/Redo operations, typically performed when processing is unsatisfactory, WCS coordinates are treated as image metadata. They can therefore be undo and redo at will.
Better annotation #
Image annotation has been improved with the integration of the Celestial Grid, its RA/Dec coordinates and a compass. All of this is accessible via a new button in the toolbar.

The preference astrometry menu has been expanded. It contains, among other things, a drop-down list for the position of the compass. A grid is now displayable in addition to the standard annotation. It is also possible to add a compass in one of the 4 corners of the image or in the center.

Add of GAIA EDR3 catalogue #
In Siril, astrometry is done from catalogs that are queried online. The brand new astrometric catalog GAIA EDR3 has been integrated into the search queries of this new version and is therefore found alongside the previous version: GAIA DR2.
User catalogue #
Since version 0.99.8, it is possible to manually annotate objects present in the image if they are not found in a catalog managed by Siril. This new version allows these manual annotations to be saved in a user catalog in order to be able to reuse them later. The user is free to display it by selecting it or not in the preferences (ctrl + p) and it is also possible to purge from here.
Type of snapshot #
Earlier versions also offered a snapshot feature to share an as-is image capture. The image is then saved in the working directory with a unique name containing the capture timestamp. Version 1.0.0 now gives the user the choice to copy the snapshot to the clipboard. Thus, a “paste” (ctrl + v) is enough to display the image in forums or various social networks.
You can choose the type of snapshot you want: a file on the disk, or in memory in the clipboard.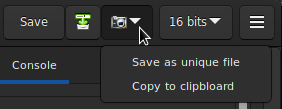
Image registration #
Improve star detection #
The star detection algorithm, which serves both global registration and astrometric resolution, has been modified to improve performance and reliability. It detects fewer false positives that could distort the alignments and estimates the profiles of the stars to resolve the PSF on a box of size adapted to each. Compared to the previous version, there should be less need to adjust the dynamic PSF settings for Siril to register the images.
Star detection comparison between version 0.99.10.1 on the left and 1.0.0-rc1 on the right.
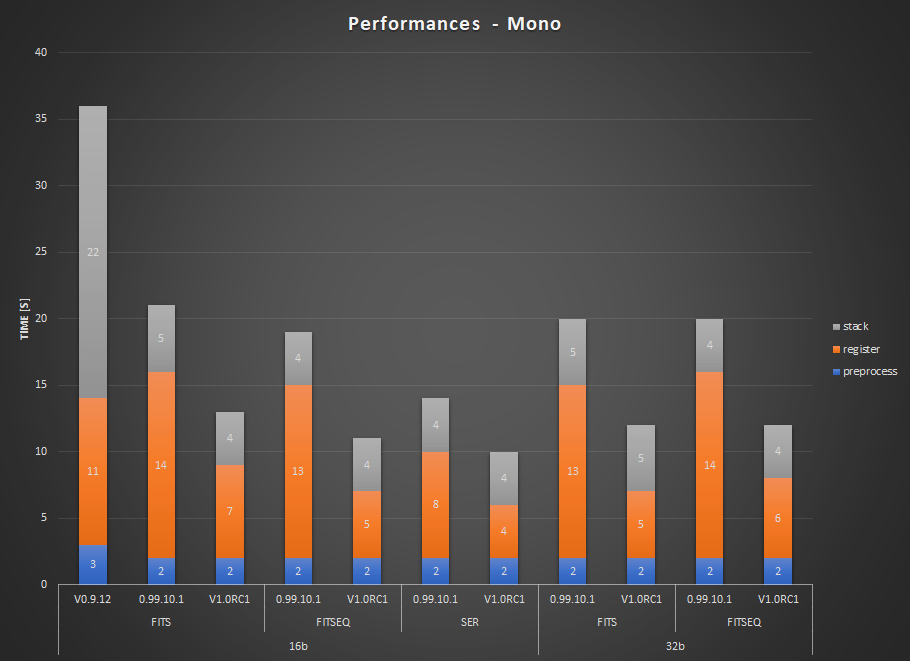
A side effect of this improvement, and not the least, is the reduction in overall registration processing time. This performance gain is also quite spectacular for monochrome images as can be seen in the following illustrations.
Performance report for a sequence of color images. The comparison is made in 16 and 32bits for versions 0.9.12, 0.99.10.1 and 1.0.0-rc1 on the 3 types of file (SER, FITS, FITSEQ). (Version 0.9.12 does not allow 32bits images to be processed, only 16bits performance is reported. It did not allow FITSEQ work either). Performance report for a sequence of monochrome images. The comparison is made in 16 and 32bits for versions 0.9.12, 0.99.10.1 and 1.0.0-rc1 on the 3 types of file (SER, FITS, FITSEQ). (Version 0.9.12 does not allow 32bits images to be processed, only 16bits performance is reported. It did not allow FITSEQ work either).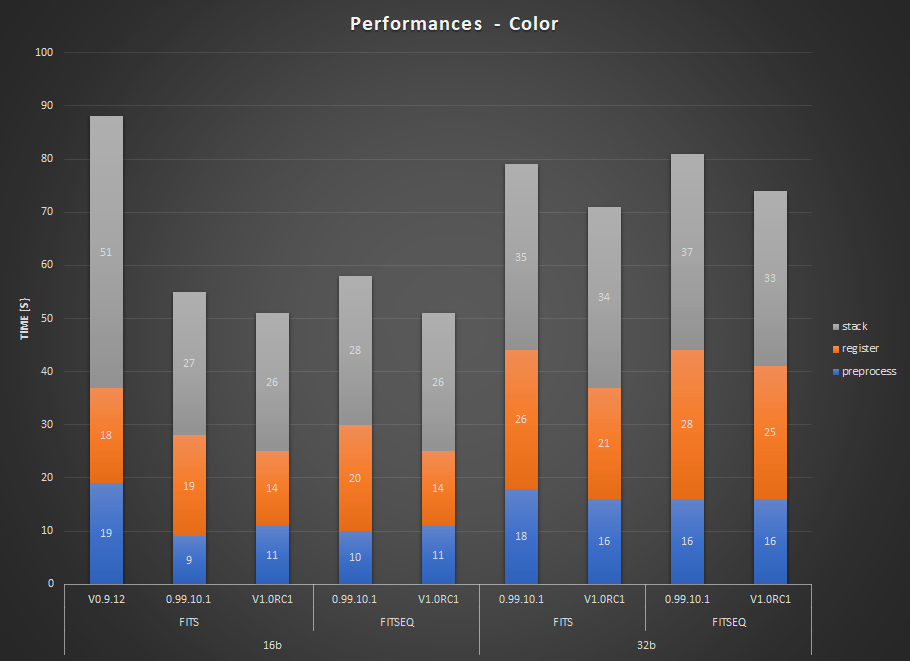
Choice of degrees of freedom #
For global registration, it is now possible to choose the number of degrees of freedom of the transformation that sends the image to be registered to the reference image. By default, the transformation is a homography , which admits a certain number of distortions between the 2 images. It is a “flexible” model which adapts very well to the general case.
But for sequences of images in which one would expect little or no distortion, this projection has too many degrees of freedom and one may wish to test more rigid projections, which will result in less interpolation. For this purpose, it is now possible to choose a translation (1 translation along each axis), a similarity (2 translations, 1 rotation and 1 scale) or an affinity (the same with shearing in addition).
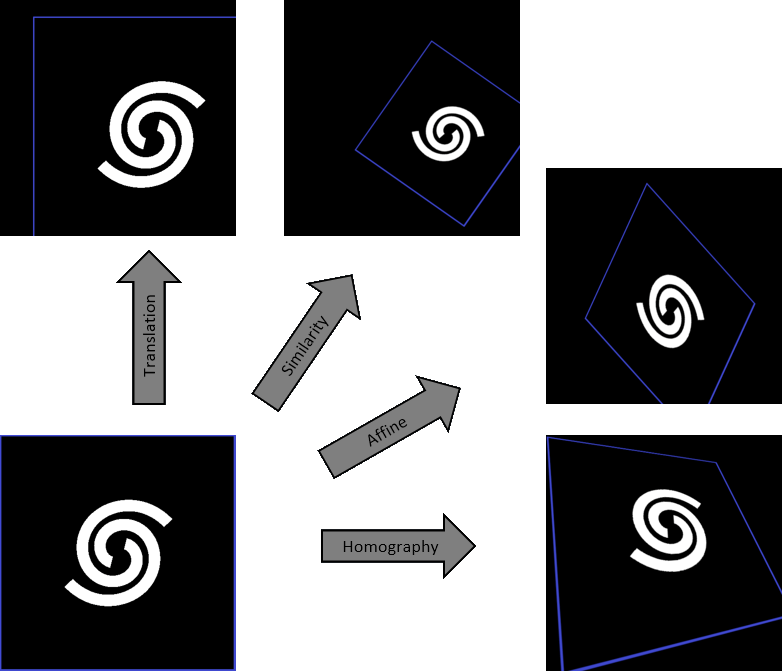
Depending on the chosen type, the transformation which sends the image to be registered on the reference image is calculated on 2, 4, 6 or 8 degrees of freedom. The higher the number of degrees, the more deformation the transformation admits between the 2 images.
New analysis tools #
Evaluate sensor tilt #
A new tool integrates the already substantial panoply of Siril analysis tools. It is used to analyze the image and indicate to the user whether or not the sensor is tilted relative to the optical axis. The latter is represented by a quadrilateral with at each vertex, the value of the FWHM used for the calculation. The image is divided into 4 equal parts in which the FWHMs are calculated. Then the FWHM of the central zone is also calculated. A sensor with zero tilt would be represented by a square with all the FWHM values identical. There are two ways to use this new feature:
- either through the dynamic PSF window (ctrl + F6), by clicking on the button with a quadrilateral.

- either by typing
tiltin the command line (tilt clearclear the drawing).

Result of the tilt function. The quadrilateral represents the tilt of the sensor.
Stars: 347, Truncated mean[FWHM]: 3.61, Sensor tilt[FWHM]: 0.57 (16%), Off-axis aberration[FWHM]: -0.30
In the console are indicated:
- the number of stars used for the measurement
- the average FWHM on the sensor, free of outliers
- the tilt, expressed as the difference between the best and the worst FWHM on the 4 corners of the image with in parenthesis the percentage of tilt deviation (value greater than 10% indicates a tilt problem)
- the aberration, expressed by the difference in FWHM between the stars in the center and the stars on the edges of the sensor
If the number of stars detected is low (<200), the dynamic PSF detection parameters allow improvement by adjusting the threshold / radius. In fact, the greater the number of stars used in the calculation, the more reliable the result of the analysis.
Warning: for the result to make sense, it is preferable to run this command on a sub and not a stacking result. A pre-processed image (just demosaiced for color sensors) is therefore ideal. Moreover, the drawn quadrilateral has its proportions exaggerated, in order to be more visible on the screen. It can’t correspond exactly to reality.
New button for quick photometry #
In the toolbar has been added a button to perform a quick photometry of the stars.

- Excellent (SNR > 40dB)
- Good (SNR > 25dB)
- Satisfactory (SNR > 15dB)
- Low (SNR > 10dB)
- Bad (SNR > 0dB)
- N/A
This last notation is displayed only if the computation failed, for one reason or another.

Photometry results window.
If the true magnitude of a star in the field is set with the command setmag, the true magnitude is shown for each selected star.

Photometry results window with true magnitude set.
More plots and more sorting #
In order to improve manual sorting of your registered frames, new plotting capabilities have been added in the Plot tab. After completing Registration of your sequence (or when loading a registered sequence), a dropdown list now enables to select parameters of interest for both plotting and sorting your data.

Select any parameter from the Y box to plot its value for the frames in the sequence. The purple curve shows value vs frame number while the green curve shows sorted values, by order of decreasing quality. The circle marker shows the value for the reference frame while the cross marker shows the value for the frame currently loaded.
You can also choose to plot one of the parameter vs another.

The values of roundness vs FWHM are displayed as a scatter plot. Hover onto the different data points to show X and Y values, together with the corresponding frame number.
Click on one of the data point to exclude the frame or to open it. The later option will load the picture and pop out the frame selector. The parameter chosen for Y values is reflected in the frame selector last column, which can then be used to sort, review and select/unselect subs from the sequence.

The choice for Y values is also reflected in the frame selector, which can then be used to sort, review and select/unselect subs. To filter in or out a frame or a group of frames from the sequence, just highlight them and press on the Space bar.
To complement sorting and filtering frames from the sequence, you can also perform a PSF on a star for the full sequence.

This plot shows the background measured by photometry per frame. You can clearly identify frames with clouds as the ones with a high background value.
Pixel Math : implementation of a first version #
Not scheduled for this release, a “Pixel Math” tool has been developed and integrated in this release candidate. The power of this tool lies in the ability to interpret mathematical formulas to apply a transformation to images, declared as variables.
Pixel Math window with the input area for formulas and those provided for the declaration of variables and functions.
Since an example is worth more than words, here is a short video presenting the Pixel Math integrated in Siril.
The following math functions are supported:
addition (+), subtraction/negation (-), multiplication (*), division (/), exponentiation (^) modulus (%), pixel inversion (~), abs, acos, asin, atan, atan2, ceil, cos, cosh, exp, floor, ln, log (or log10), log2, pow, sin, sinh, sqrt, tan, tanh, trunc
The following functions are also built-in and provided by Pixel Math:
fac(factorials e.g.fac 5 == 120)ncr(combinations e.g.ncr(6,2) == 15)npr(permutations e.g.npr(6,2) == 30)
Also, the following constants are available:
pi, e
New commands #
tilt: This command is explained above. It displays a drawing representing the tilt of the sensor. Theclearoption can be passed as an argument in order to clear the drawing.dir: This command only exists on the version compatible with Microsoft Windows and it is the equivalent of thelscommand already present in the UNIX versions. It allows you to list the Siril compatible files present in the working directory.seqcosme and seqcosme_cfa: Applies the local average to a set of pixels on the sequence given in argument (cosmetic correction). The coordinates of these pixels are in an ASCII file[.lst file]also given as an argument. This command is suitable for correcting residual hot and cold pixels after preprocessing when, for example, it is not possible to apply master darks. The command is available in 2 versions, one for monochrome and one for CFA images.boxselect: This command gives the possibility of making a selection withx,y,widthandheight, withxandybeing the coordinates of the upper left corner, andwidthandheight, the size of the selection (width and height). If no argument is passed and a selection is active,x,y,widthandheightare written in the Console tab.
Refactoring of command help #
Some commands, becoming more and more complex, had a help that was difficult to read and understand. These have therefore been completely revised, corrected and reformatted.
The help of the stack command accessible by clicking on the button to the right of the command line.
Contributors #
Contributors to this release are: Cyril Richard, Cécile Melis, Vincent Hourdin, Florian Benedetti, ratmilk, Anthony Hinsinger, Andreas Kempe, Benjamin A. Beasley, Steffen Schreiber and Guillaume Roguez.
Translators #
Cyril Richard, Stefan Beck, Kostas Stavropoulos, Xiaolei Wu, Joaquin Manuel, Alexandre Prokoudine, Luca Benassi, Antoine Hlmn, Kenji Iohara, Marta Fernandes
Donate #
Developing software is fun, but it also takes up nearly all of our spare time. If you like Siril and would like to support us in continuing development you’re welcome to donate a small amount of your choice.